
When Delivery Breaks: Downtime by Hour and Day
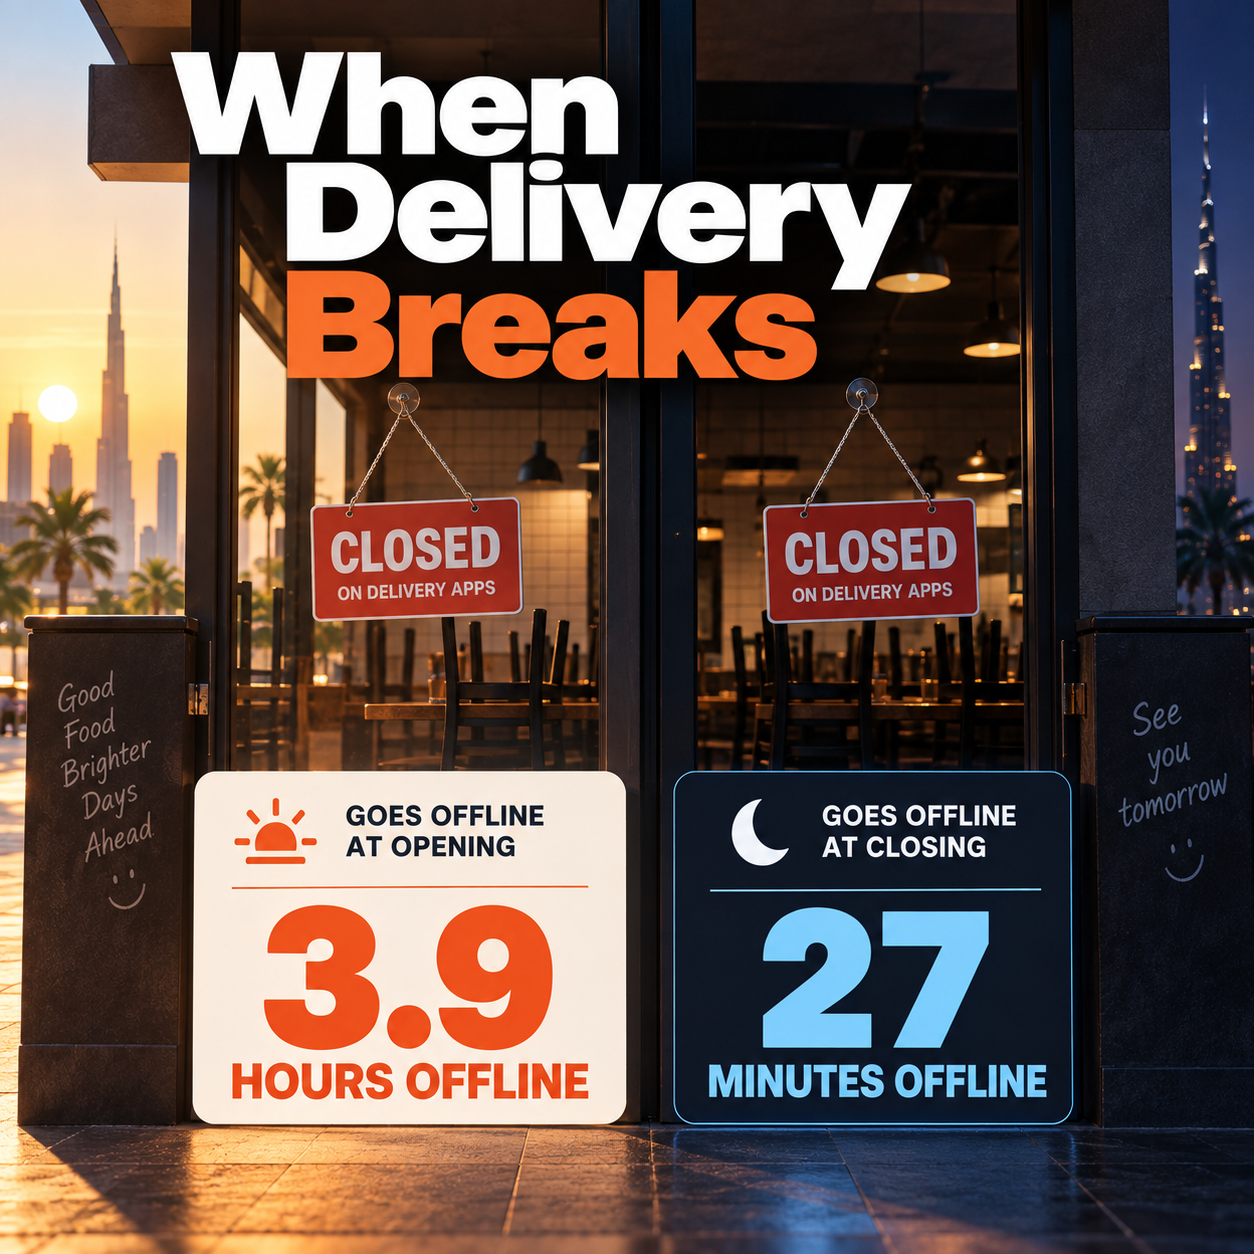
Your kitchen opens on time. Your listing may not. Among UAE restaurants monitored by Kitchain, an outage that began in the opening hour lasted 3.9 hours on average in August 2026, while one that began in the closing hour lasted 27 minutes. The cost of an outage is set by when it starts, and the hour that decides the day is the first one.
The outage that starts with the shift
The costliest outage is the one that begins when your shift does, because nobody is looking and it runs for hours.
Your kitchen opened at ten. On one app, the listing woke up at lunch. The POS said “open” the whole time, the line was staffed, and on that one storefront the customer saw a closed restaurant.
The metric here is listing availability: the share of scheduled trading time during which a restaurant’s public listing could not take orders. It does not measure whether the kitchen was working. The sample is restaurants monitored by Kitchain that have a declared trading schedule, in the UAE, Kuwait and the UK, in August 2026 against July.
In the UAE in August, an opening-hour outage lasted 3.9 hours on average (231 minutes); a closing-hour outage, 27 minutes. In Kuwait’s first hour of trading the figure was 4.4 hours (265 minutes), driven by one date, 24 August, covered below.
The length is the stable part. In the UAE, opening-hour outages averaged between 121 and 276 minutes in every month from May to August. In the UK they averaged 327–377 minutes from June to August. UAE closing-hour outages averaged 18–27 minutes from June to August.
What this means for a restaurant: a listing that does not wake up with the kitchen misses a whole service. An outage at the end of the day costs you the last half hour; one at the start costs you lunch.
Three windows, two different costs
How long an outage lasts depends on its window and barely moves from month to month. Where the lost minutes land does move, and in the UAE it flipped between July and August.
Each restaurant’s trading day has three windows: the opening hour, the middle of the day and the closing hour. Each day with an outage (an outage-day) goes to the window that held its worst hour, the hour with the most downtime. For the UAE:
| Window, month | Share of outage-days | Share of lost minutes | Average outage |
|---|---|---|---|
| Opening hour, July | 7.9% | 24.1% | 217 min |
| Opening hour, August | 35.8% | 68.7% | 231 min |
| Middle of the day, July | 43.9% | 57.1% | 92 min |
| Middle of the day, August | 26.5% | 22.6% | 102 min |
| Closing hour, July | 47.8% | 17.4% | 26 min |
| Closing hour, August | 37.3% | 8.4% | 27 min |
The average outage hardly changed: 217 then 231 minutes in the opening hour, 26 then 27 in the closing hour. The share of lost minutes did. In July the opening hour carried 24.1% of the UAE’s lost minutes and the middle of the day 57.1%. In August the opening hour carried 68.7%. That is August’s picture, not a law of the market.
The closing hour is the frequent-but-cheap window. In August it held 37.3% of outage-days but 8.4% of lost minutes: the listing went dark 27 minutes before the declared close, on average.
Picture a café chain in Abu Dhabi that closes at 22:00. As a scenario: its listings go dark 27 minutes before the declared close, the August average. If that happens on ten evenings a month, it is 10 × 27 minutes = 4.5 hours of scheduled trading time lost to the last half hour, spread so thin that no daily report flags it. Cheap per evening, regular every month, fixable once someone sees the pattern.
The UK is the one market where the morning share stayed high: the opening hour carried 40.2–53.2% of lost minutes in every month from June to August.
What this means for a restaurant: count outages and you will worry about closing time. Count lost trading hours and you will look at the opening hour, because that is where the long outages are.
Who breaks in the morning, who in the evening
The window that matters differs by platform and by market, and it can flip within a month.
In July the UAE’s problems were evening ones. 63.4% of Deliveroo’s and 64.7% of Noon’s outage-days fell between 18:00 and 22:00. In August the picture moved to the morning. The table shows, per platform, the share of lost minutes that fell in the opening hour and the share of outage-days that fell in the evening. Demo accounts are excluded; platforms are in alphabetical order.
| Platform (UAE) | Opening-hour minutes, July | Opening-hour minutes, August | Evening outage-days, July | Evening outage-days, August |
|---|---|---|---|---|
| Careem | 4.3% | 54.8% | 31.4% | 22.1% |
| Deliveroo | 15.1% | 81.5% | 63.4% | 0.7% |
| Keeta | 11.9% | 23.7% | 10.7% | 6.2% |
| Noon | 10.3% | 49.2% | 64.7% | 8.1% |
| Talabat | 34.8% | 73.5% | 15.8% | 19.1% |
On Deliveroo the opening hour’s share of lost minutes went from 15.1% in July to 81.5% in August, while its evening share of outage-days went from 63.4% to 0.7%. Talabat’s opening-hour share went from 34.8% to 73.5%.
These are not morning accidents. In our sample, a group of Deliveroo listings switch on later than their declared hours: 2.5 hours after the declared opening, every day. That is a schedule mismatch, and it repeats daily until someone corrects one side or the other. A group of listings like that can move most of a market’s lost minutes into the morning.
Kuwait looks different. Its platforms open on time: measured by each restaurant’s scheduled opening hour, that hour carried 0% of lost minutes in July and 0–0.6% in August across Deliveroo, Talabat, Keeta and Snoonu. Kuwait’s outages are platform-wide rather than tied to the opening hour. In August, 67.8% of its outage-days fell in the middle of the day, and 19.6% of Deliveroo’s and 16.7% of Talabat’s between 18:00 and 22:00. The one morning that stands out, 24 August at 07:00, is an event with a date, not a habit.
What this means for a restaurant: “mornings are risky” and “evenings are risky” are both true for somebody, in some month. Ask instead on which platform, in which window, your own listings go dark, and whether that changed since last month.
The Friday myth
There is no weekly rhythm in this data. There are dates. The weekday peaks an ops team might staff around turn out to be one or two calendar days each.
Share of scheduled trading time unavailable, by day of the week (demo accounts with real listings included):
| Market, month | Sun | Mon | Tue | Wed | Thu | Fri | Sat |
|---|---|---|---|---|---|---|---|
| UAE, July | 0.21% | 0.56% | 0.42% | 0.91% | 0.31% | 0.42% | 0.21% |
| UAE, August | 0.61% | 0.91% | 0.82% | 0.73% | 0.78% | 1.90% | 0.93% |
| Kuwait, July | 0.40% | 0.18% | 0.51% | 1.02% | 0.34% | 0.62% | 0.27% |
| Kuwait, August | 0.19% | 3.08% | 0.06% | 0.43% | 0.05% | 0.06% | 0.06% |
Two cells stand out: the UAE’s August Friday at 1.90% against 0.6–0.9% on the other days, and Kuwait’s August Monday at 3.08%. Read by date, they say something else.
- Monday 24 August, Kuwait: 10.58% unavailable for the day. Every Keeta listing in the sample was down for about two hours from 07:00, along with 59% of Snoonu’s restaurant–platform pairs.
- Monday 10 August, Kuwait: 4.80%. 97.7% of Snoonu pairs had an outage.
- Friday 28 August, UAE: 5.36%, on Deliveroo listings. Saturday 29 August followed at 2.25%.
The UAE’s Friday is one date, 28 August. Kuwait’s Monday is two dates, 10 and 24 August. Every other August day was under 1.3% in the UAE and under 1% in Kuwait. Strip those dates out and every weekday sits at 0.6–0.9% in the UAE and 0.05–0.4% in Kuwait. In the UAE, 7–10% of pairs had an outage on any day of the week, in both months.
A few dates decide a platform’s month:
- Three days of August produced 83.5% of Keeta’s monthly downtime in Kuwait.
- Five days produced 90.8% of Snoonu’s.
- In July, one evening, 22 July from 20:00, took 40.4% of Deliveroo’s UAE pairs offline for 4.6 hours.
Picture a Kuwait City grill brand on four platforms whose ops lead adds a floor manager on Monday mornings because “Mondays are bad”. As a scenario: Kuwait’s Monday did average 3.08% in August. But an ordinary Kuwait day is under 0.2% unavailable, and that Monday figure is two dates on which one platform’s listings went down all at once. The right response is not a Monday rota. It is a rule: on any morning, if one platform’s listing is dark while the others trade, someone checks within fifteen minutes.
What this means for a restaurant: before you change a rota because of a weekday, open the dates behind it. One event can own a month’s average.
The map: hour × day of week, UAE, August
The UAE’s August map has one loud row. Each cell is minutes of downtime by the worst hour of each pair-day, excluding demo accounts.
- The 07:00 row dominates every day of the week. From Sunday to Thursday its cells hold between 12,649 and 23,374 minutes. It is the opening hour, seen on a grid.
- The Friday and Saturday 07:00 cells, 84,033 and 41,096 minutes, are the 28–29 August event, not a weekend effect.
- The midday cells, 12:00 to 15:00, are the steady background. The 12:00 row runs from 2,083 to 8,183 minutes: present every day, never close to the morning row.
- The 00:00 row is not read as night risk. Round-the-clock schedules in the system are an input default, not real trading hours.
What this means for a restaurant: your own map will have a loud row too. Check whether it is loud every week or on two dates.
What to do with your own map
Three moves follow from the data. Every scenario here is a picture, not a client.
1. Check that every listing is live in the first fifteen minutes of each shift. Picture the ops director of a 15-branch shawarma chain in Dubai whose shifts start at 10:00. As a scenario: one platform’s listing for six branches switches on at 12:30 every day, because the schedule on the platform does not match the one the kitchen runs. At the August average, an opening-hour outage lasts 3.9 hours, longer than a full lunch service (roughly 11:30 to 14:30, three hours). The POS says open, and the storefront on that app is dark exactly when the orders would come. Nobody in the building sees it, because nobody opens the app at 10:00.
2. Compare the schedule you declared with what the platform actually shows. August’s morning peak in the UAE was a schedule mismatch, and a listing that switches on later than its declared hours will do so again tomorrow. Put the declared hours and the observed switch-on time side by side, per branch and per platform, and correct whichever side is wrong.
3. Read your map by date and platform, not by weekday. On 76% of UAE outage-days and 69% in Kuwait, only one platform’s listing was down while the others kept trading; “everything down” happened on 6.5% and 4.3% of days. One dark storefront among live ones is the normal shape of an outage, and the easiest to miss.
Kitchain Alert does the checking for you. It opens the public storefront the way a customer does, around the clock, and sends an incident to WhatsApp, Telegram or email the moment a location goes offline, plus one daily morning report. No integration, no platform login.
How we measured
What is measured. Listing availability, not kitchen operation: whether the restaurant’s public listing could take orders during the hours the restaurant declared as trading hours. We count lost trading hours, never revenue.
Sample and period. Restaurants monitored by Kitchain that have a real declared schedule: a few hundred in the UAE and Kuwait and about a hundred in the UK. Period: August 2026 against July; some series start in May (UAE) or June (UK). Dead listings are excluded, as is a handful of restaurants whose hours could not be parsed. The figures follow version 2 of our availability methodology and were taken on 10 September 2026.
How a day is assigned to an hour. For each pair-day, downtime is clipped to the declared schedule, and the day is assigned to its worst hour. The window tables and the map are therefore not a distribution of downtime across hours. “Average outage” for a window is the average downtime on the outage-days assigned to that window.
How windows are defined. The opening and closing windows follow the first shift of each restaurant’s Monday schedule. For restaurants with different hours on different days, or with split shifts, a window can be off by an hour. Kuwait’s 4.4-hour figure belongs to the first hour of trading, 07:00, not to the scheduled opening hour.
Demo accounts. The window table, the platform table and the map exclude demo accounts, whose declared schedules can be inaccurate. The weekday table and the daily figures include them.
What is not covered.
- Night and Saudi Arabia. Round-the-clock schedules in the system are an input default, so night-time outages cannot be tested. Saudi Arabia is absent for the same reason.
- Causes. “Switch on later than their declared hours” describes what the listing did against the declared schedule, not which side of the mismatch is out of date.
- Next month. We will keep watching whether the UAE’s morning profile holds.
Glossary:
- Pair-day. One restaurant–platform pair (one restaurant on one platform) on one calendar date.
- Outage-day. A pair-day with any downtime inside scheduled trading time.
- Worst hour. The hour of a pair-day with the most downtime.
- Scheduled trading time. The hours the restaurant declared as trading hours.
- Opening / closing window. The first and last hour of the restaurant’s declared shift.