
An Outage Is Worth What It Takes to Reach Someone Who Can Act
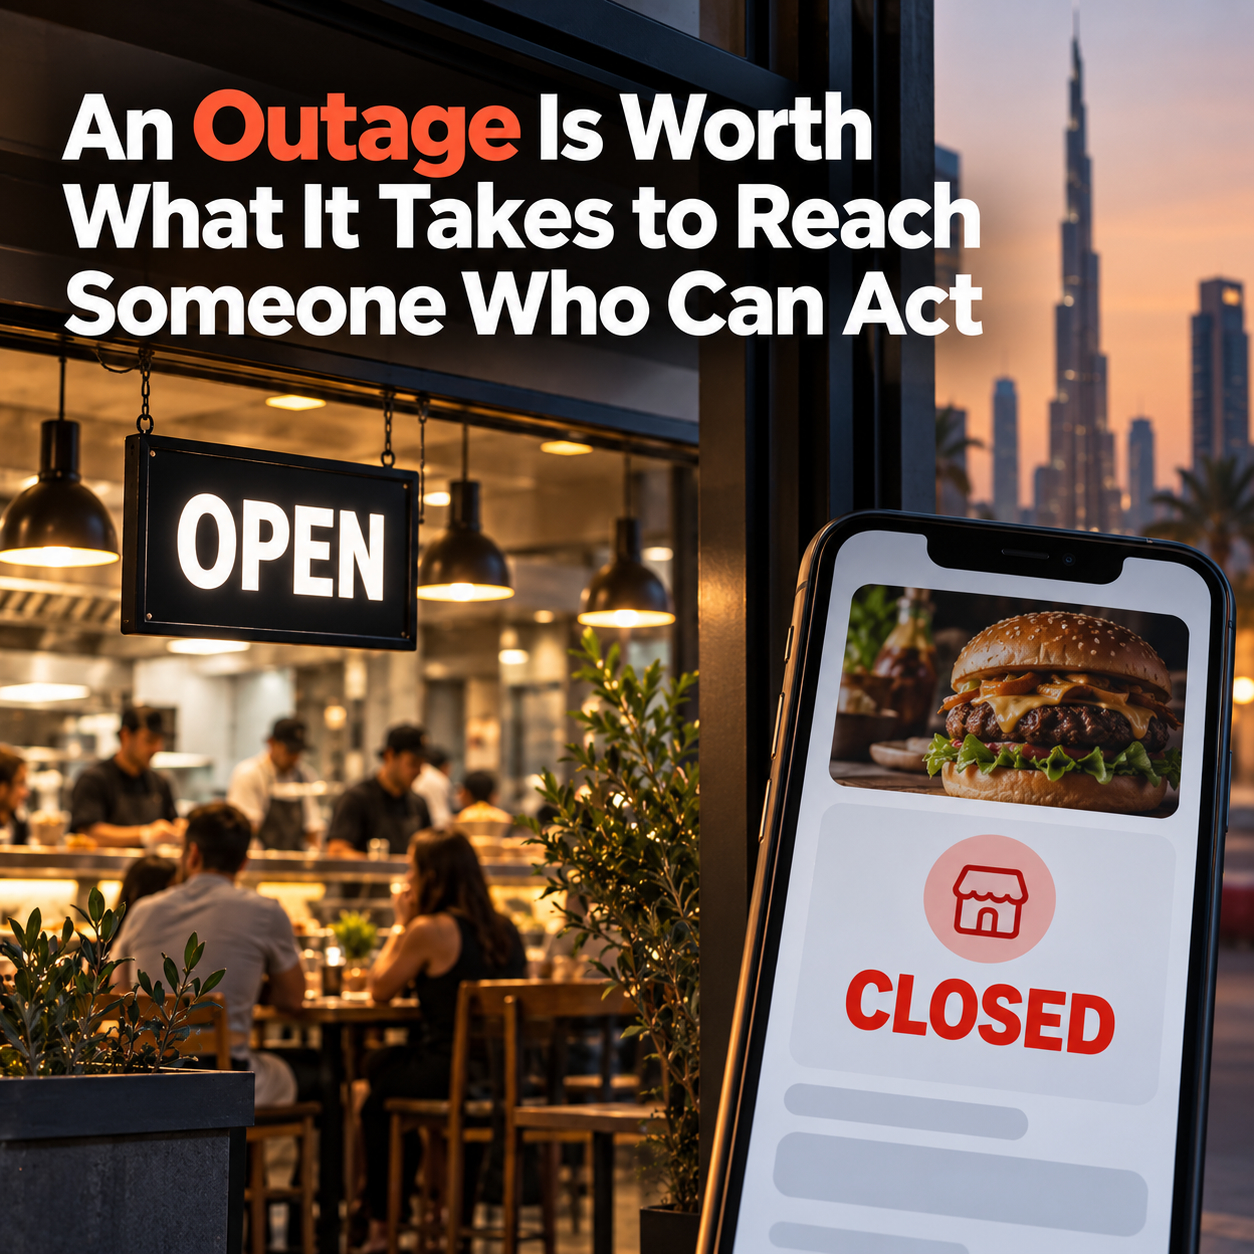
The typical delivery-platform outage in our sample ends in 29 minutes. The one that starts with the shift runs 3.9 hours, and it is not a platform failure: the listing simply switched on later than its declared hours, which anyone looking at the storefront at the start of the shift would have seen. The gap between half an hour and four is not how hard the fix is. It is how far the signal travels before it reaches someone who can act.
An outage that lasts four hours because nobody knows for four hours
Your POS says the Marina branch is open. On one delivery app, the customer sees it closed. Each platform holds its own live status for your store, so a location can take orders on one app and be dark on another at the same moment, and the POS never tells you. The kitchen is open, the order screen is on, and one storefront stays dark through the whole morning.
The metric behind this article is listing availability: the share of scheduled trading time during which a restaurant’s public listing could not take orders, measured across restaurants monitored by Kitchain with a declared schedule, in the UAE and Kuwait, in August 2026. It says nothing about the kitchen; it says whether the customer could order.
Most outages are short: the median time to recover in the UAE was 29 minutes. But the length of an outage depends on when it starts. In August, an outage that began in the opening hour lasted 3.9 hours on average in the UAE (231 minutes); an outage in the closing hour lasted 27 minutes. This is not one month’s accident: across every month we have measured, an opening-hour outage averaged between two and six hours, and in the UAE it was 217 minutes in July and 231 in August.
What did move is how much of the month’s losses that window carried: in August, 69% of the UAE’s lost minutes fell in the opening hour; in July it was 24%. That share is a dated picture and rests on a small group of listings. The August morning peak is not a platform failure. It is a listing that switches on later than its declared hours, day after day, while the kitchen behind it is already cooking.
Here is what the data suggests, and it is the argument of this article rather than something we measured: an opening-hour outage is long because nobody sees it where the work happens. A listing that switched on late is visible to anyone who opens the app at the start of the shift. It stays dark for hours because the person who would notice is taking orders, and the alert, if there is one, lands in a manager’s messenger, not at the pass. The outage ends when the signal reaches a person who can act.
Anatomy of an outage: half an hour typical, hours in the tail, and the tail is almost everything
Most outages fix themselves or get noticed fast; the losses come from the tail, and the tail grew between months.
Median time to recover was 29 minutes in the UAE and 27 in Kuwait, and three quarters of UAE outages ended within an hour (74.8%). Yet one in fourteen UAE outage-days contained a stop longer than ten hours (7.0%), and 9.2% contained a stop of four hours or more. In July the ten-hour-plus share was 1.1%.
The tail sits in a handful of storefronts. In the UAE, 62% of restaurant–platform pairs lost nothing in August. The 7% of pairs with downtime on 20 or more days produced 70% of all losses, at 50.8 hours per pair a month. A pair with downtime on one to three days lost 4.6 hours. (Pair figures exclude demo accounts; see How we measured.)
| UAE pairs, August 2026 | Share of pairs | Share of lost hours | Lost hours per pair |
|---|---|---|---|
| No downtime | 61.7% | 0 | 0 |
| Downtime on 1–3 days | 29.5% | 26.7% | 4.6 |
| Downtime on 4–19 days | 1.8% | 3.8% | — |
| Downtime on 20+ days | 7.0% | 69.5% | 50.8 |
By restaurant, the same: the median UAE restaurant lost 36 minutes in August, and the worst 20% of restaurants accounted for 90% of all downtime.
A pair that is down on twenty days of the month is not twenty surprises. It is one outage that nobody turns into a task, repeated every day. For an operations director, that is the good news inside the bad: the losses have addresses.
Kuwait shows the other shape. Listings there were unavailable for 0.62% of scheduled trading time, 19 lost trading hours per restaurant a month, close to the UAE’s 18. But the hours are spread thin: the median Kuwait restaurant lost 9.0 hours, only 1% lost nothing, and no pair was down on 20 or more days. In one market the signal is needed by a few storefronts every day; in the other, by nearly every storefront, rarely. In both, the path from signal to action decides how many of those hours are lost.
Where the signal has to land: three places where the work happens
Kitchain Alert already sends the incident to WhatsApp, Telegram or email the moment a location goes offline, plus one daily morning report. That is where an outage gets read, not always where it becomes an action.
The places where an outage turns into work are three: the POS terminal, where the shift sees “branch not taking orders on platform X” next to its orders; the helpdesk, where an outage becomes a ticket with an owner and a deadline; and the task tracker or franchise platform, where an outage at a franchisee becomes a dated task. One scenario per place.
Scenario: the terminal. Picture a 12-branch burger chain in Dubai whose shifts start at 10:00. On one platform the listing for three branches switches on at lunch because the schedule on the platform does not match the one the kitchen runs. At the August average, such an opening-hour outage lasts 3.9 hours, and today it lasts exactly that, because the only person who would notice opens the app at 14:00. Now the same incident appears on the terminal at 10:05, beside the order queue: “Platform X: branch not taking orders since scheduled opening.” The shift lead sees it before the first order of the day, and the listing is back within the typical recovery time. The gap was never the technology. It was the seat the signal lands in.
Scenario: the helpdesk. Picture a franchise group in Abu Dhabi with a central support desk. Its ops director gets outage alerts in a messenger group with forty other messages an hour. One pair has been down on 20 or more days this month; at the August average, that pair lost 50.8 hours. In the group it is a message that scrolls past. In the helpdesk it is one ticket, opened when the outage started, with an owner, a deadline and a closing note when the listing came back. On the third day, the same ticket reopening turns “a flaky storefront” into a scheduled fix. No repeat reminders, so the desk does not learn to mute it.
Scenario: the franchise task tracker. Picture a Kuwait City brand with 30 franchised branches on four platforms. On 69% of Kuwait outage-days only one platform’s listing is down while the others keep trading, so a message saying “branch offline” sends the franchisee to the wrong app, and the reply comes back “we are open”. A task that names the platform and the branch, opens when the outage starts and closes when it ends, gives the franchisee one thing to do and head office one number to review: how long tasks stay open per branch.
The data says what the signal must carry to survive the trip:
- The platform, not “the restaurant is offline”. On 76% of UAE outage-days and 69% in Kuwait, only one platform’s listing was down while the others kept trading. “Everything down” happened on 6.5% and 4.3% of days.
- The branch’s declared hours, per platform. 37% of UAE outage-days fall in the closing hour: the listing goes dark 27 minutes before the declared close on average, cheap in minutes (8% of lost time) but regular. That is a schedule mismatch, and only a system that knows when the branch should be trading, including a branch that closes earlier on one platform than on the others, can see it.
- One event at the start and one at the end. Otherwise one outage becomes ten tickets, and the desk learns to ignore all of them.
Monitoring starts with no integration and no platform login. If you want the incident inside your own systems, that is an option: the same incident Kitchain already sees arrives in your terminal, helpdesk or task tracker under your own branch identifiers, available to customers on request. The same holds for vendors of POS, helpdesk and CRM systems: what your customers see at the terminal is your product, and the outage signal is one more thing it can show. Integration marketplaces for restaurant systems already exist in the region: Foodics, for example, lists “100+ App Integrations for Restaurants” on its public marketplace page, with “Delivery Management” among its categories.
Five questions to ask any supplier of outage events before you automate on them
A messenger alert forgives imprecision, because a person rechecks before acting. An event that opens a ticket or escalates a shift on its own does not. Before you automate on anyone’s outage events, ours included, ask five things. For each: the business consequence of a bad answer, then Kitchain’s answer. Some of our answers are inconvenient; we give them as they are.
- One event per incident, or a stream of reminders? Bad answer: one outage, ten tickets, and a shift that stops reading. Kitchain: one event when the outage starts, one when it ends, no reminders, no digests.
- What happens when our receiver is down? Bad answer: a silent hole in the report. Kitchain: delivery is retried for more than a day; a receiver that keeps failing for days is switched off, and you switch it back on yourself once it is fixed. What happened while it was off is not re-sent; the status history is there to catch up from.
- Can we verify an event came from you, and that it did not arrive twice? Bad answer: forged or duplicated tickets inside your automation. Kitchain: every delivery is signed under an open standard, Standard Webhooks, and a repeat carries the same identifier, so your system recognises it.
- How do we catch up on what we missed? Bad answer: a week’s report cannot be rebuilt. Kitchain: a status history per branch per platform for up to 30 days, the raw record of checks, not an interpretation.
- How does an event differ from the current state? Bad answer: an “open/closed” dashboard built from events, which lies. Kitchain: events mark the start and end of outages; the current status is read separately. You cannot judge whether a branch is open right now from events alone, and we say so.
One more, because it follows from the closing-hour data above: events come only inside trading hours, so the schedule has to be right, including different hours on one platform.
What this changes in hours: a scenario
As a scenario, picture a chain whose branch has an opening-hour outage: the listing switched on late. In our sample such an outage lasted 3.9 hours on average (UAE, August 2026). If the shift sees the incident at the terminal in the first minutes and the listing is back within the typical recovery time, the median across all outages was 29 minutes, the branch loses about half an hour of that morning instead of nearly four: 3.9 h − 0.5 h ≈ 3.4 hours per such outage. This is a scenario, not a promise about reaction time: the data contain no measurement of the delay between an outage and its event, and Kitchain reports the outage rather than switching the listing back on.
The chronic pair is the other image. A pair with downtime on 20 or more days lost 50.8 hours a month in August. Read as an operations problem rather than a statistic, that is what an outage with no owner looks like: the same storefront, dark for a stretch of every day, noticed by nobody whose job it is to notice.
And the scale, as a scenario: UAE listings were unavailable for 0.94% of scheduled trading time in August, which is 18 lost trading hours per restaurant a month. 18 hours ≈ 4 lunch services. Multiply by your branches, and you have the size of the thing the signal has to reach in time.
Monitoring starts with no integration and no platform login. The incident inside your own systems is an option, available to customers on request.
How we measured
What the metric means. Listing availability is the share of scheduled trading time during which a restaurant’s public listing on a delivery platform could not take orders. It measures the storefront the customer sees, not kitchen operation. We see no orders, so the losses are lost trading hours, never revenue.
Sample. Restaurants monitored by Kitchain with a declared schedule: a few hundred in the UAE and in Kuwait. Dead listings are excluded. Demo accounts with real listings are included in the country totals and the outage-length figures, and excluded from the pair table and the opening- and closing-hour windows, which depend on the schedule.
Windows of the day. Opening and closing hours are taken from the branch’s first shift on a Monday; for branches with different shifts by day or split shifts, the window can be off by an hour.
Typical and tail. “Typical outage” is the median time to recover across outage-days. “The tail” is the share of outage-days whose longest stop was four hours or more, or ten hours or more.
Period and version. August 2026, with July 2026 for comparison. Methodology v2. Figures taken on 10 September 2026.
What we did not measure. The delay between an outage and the moment a person learns about it, and the effect of delivering an incident to a terminal, a helpdesk or a task tracker. Those are the article’s argument.