
Coverage Radius: How Far Delivery Promises Really Reach
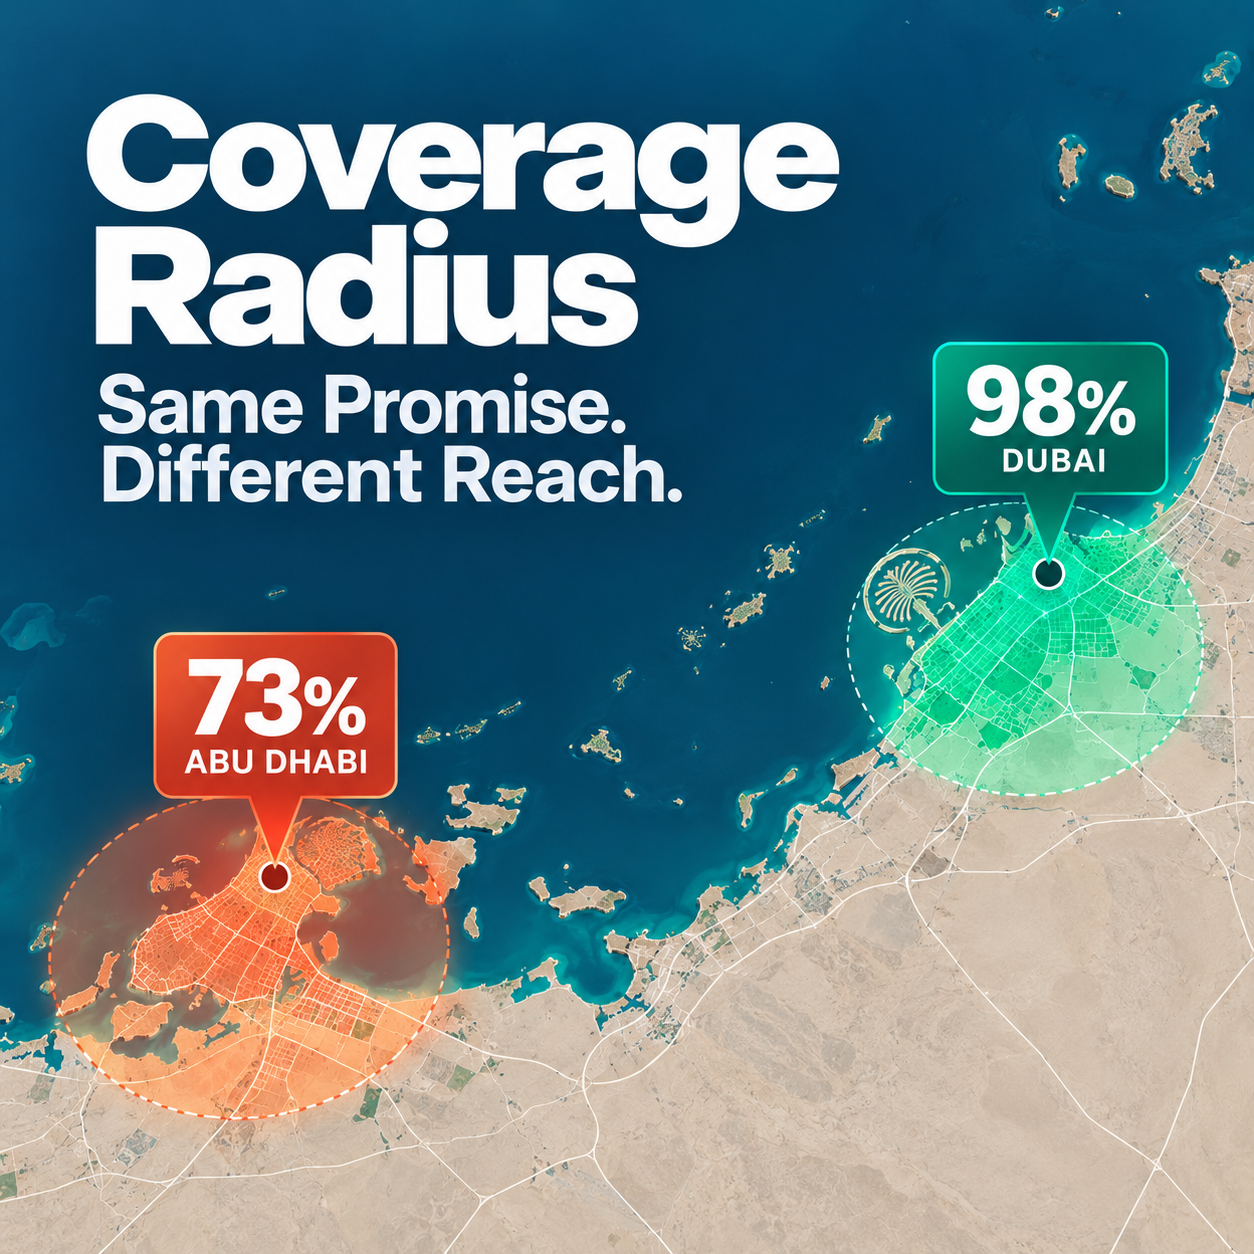
Your storefront promises 25 minutes in Dubai and 30 in Abu Dhabi, and the two numbers look like the same business in two cities. They are not. In our sample, the typical brand is orderable at 98% of the Dubai addresses we check on Deliveroo and at 73% of Abu Dhabi’s: the promise barely moves between cities, while in one city one check in four finds nothing at all.
Same promise, different city
Open your Dubai storefront on Deliveroo and it promises 25 minutes. Open the Abu Dhabi one and it promises 30. Five minutes apart (25 against 30), same kitchen concept, same zone template, so you plan the second city like the first. The delivery time on the storefront, though, says nothing about whether the customer at a given address finds you. In Abu Dhabi, among the brands monitored by Kitchain, one check in four (27% on Deliveroo) does not find the brand at that address at all.
This piece tracks two numbers, and they need defining before any comparison:
- Coverage is the share of addresses across the city where the brand is found and accepting an order, taken as the median over the month. It is not a share of the population and not a share of orders; it is a share of addresses.
- The promise is the delivery time the app displays at the moment of the check — the lower bound of the window, so a “25–35” counts as 25. It is not the actual delivery time.
The sample is brands monitored by Kitchain in Dubai, Abu Dhabi and Riyadh, August 2026, with July for comparison where the two months overlap. It is a client sample, not the market, and brands are not named.
Coverage: where the customer finds you at all
Being listed in a city is not being reachable across it. In Dubai the map is nearly full on both platforms; in Abu Dhabi, for most brands, a quarter to a half of the city is outside the radius.
Dubai first. The typical brand in our sample is available at 98% of the city addresses we check on Deliveroo and 90% on Talabat. The gap between the two is one address in ten: an address where the customer can order on one platform and not on the other. And the picture is broad, not driven by a few outliers: 91% of brands cover 75% of the city or more, on both Deliveroo and Talabat.
Abu Dhabi reads differently. Median coverage is 73% on Deliveroo and 75% on Talabat. Only 33% of brands on Deliveroo and 42% on Talabat cover three quarters of the city or more; the rest sit in the 50–75% band. Put plainly: for most monitored brands in Abu Dhabi, somewhere between a quarter and a half of city addresses are not orderable.
What this means for a restaurant comes in two parts. First, a Dubai playbook copied to Abu Dhabi lands in a city where one check in four finds nothing, and no line on the storefront says so. Second, even inside Dubai the two platforms do not cover the same addresses. A city plan built on one app’s zone is a plan for part of the city; the working unit is the restaurant–platform pair, not the city.
Picture a three-kitchen burger brand in Dubai choosing where to put the fourth. The team looks at the storefront: 25 minutes promised on one app, 30 on the other, so “the city is covered”. In our sample the typical Dubai brand is reachable at 98% of the addresses we check on one platform and 90% on the other — one address in ten is orderable on one app and not the other. The fourth kitchen should go where the maps disagree, and the team only finds that out by checking addresses per platform, not by reading the minutes.
Found but closed
There is a second way to lose a customer at an address, and it never shows up as “not found”. On Talabat Abu Dhabi, 7% of checks find the brand at the address but it is not taking orders. On Deliveroo Abu Dhabi the same figure is 0%.
A customer typing an address can hit one of two states:
- Not found. The storefront does not appear at that address. It is outside the delivery zone the platform holds for the branch, or no branch of the brand reaches it.
- Found but closed. The storefront appears, the customer sees the menu, and the order cannot be placed. The address is inside the zone, but the branch is not accepting orders at that moment.
The two states have different owners. “Not found” is a zone question: which branch is assigned to which districts, and how far the platform’s radius reaches. “Found but closed” is a schedule or availability setting: the branch is inside the radius but is closed at check time, paused, or otherwise not accepting. Fixing the first means redrawing zones or opening a kitchen; fixing the second usually means correcting opening hours and pause states on the platform.
One caution on reading the Talabat figure. Our data gives the found-but-closed share for Talabat Abu Dhabi and the median coverage of 75%; it does not give a “not found” share, and the two cannot be added or subtracted into one. Treat “found but closed” as its own line in the report, next to coverage, not as a piece of it.
Picture a cloud kitchen in Abu Dhabi running five virtual brands, launched with the same zone settings the operator used in Dubai. The storefront promises 30 minutes, the kitchen is open, uptime says 100%. At the Abu Dhabi Deliveroo median of 73%, a customer searching at one address in four gets nothing at all, and on Talabat 7 of every 100 checks find the brand but cannot order. As a scenario calculation: 98% − 73% = 25 points of the city that the Dubai plan assumed and the Abu Dhabi map does not deliver.
What the promise actually says
The promised minutes are nearly the same across cities and platforms in the UAE, and they say nothing about reach. Here are the distributions, with a caveat that comes first: platforms differ in the window they show. Keeta shows a 10-minute window (“25–35”), Talabat a 15-minute window, Deliveroo a single number. We compare the lower bound in every case, so a Keeta “25–35” enters the data as 25. Medians of a lower bound are comparable only with that in mind.
| Platform, city | Median promise | Window shown | Shape of the distribution |
|---|---|---|---|
| Deliveroo, Dubai | 25 minutes | single number | 75% of checks at 30 minutes or less; 26% at 20 or less |
| Talabat, Dubai | 30 minutes | 15 minutes | 54% within half an hour; 44% in the 31–45 band |
| Keeta, Dubai | 29 minutes | 10 minutes | long tail: 24% of checks at 46 minutes or more |
| Keeta, Riyadh | 46 minutes | 10 minutes | 52% of checks over 45 minutes |
| Deliveroo, Abu Dhabi | 30 minutes | single number | — |
Deliveroo Dubai has the shortest median promise in our sample. Talabat Dubai splits almost evenly between “within half an hour” and “31–45”. Keeta Dubai’s median sits close to the others, but a quarter of its checks show 46 minutes or more. Keeta is a first read — measured over 5–8 days in late August — and has no July comparison.
Riyadh appears here and nowhere else in this piece: we have a promise figure for Keeta Riyadh (median 46 minutes, 52% over 45) but no coverage figure for the city, so Riyadh gets no radius.
Picture a Riyadh grill brand on Keeta reading its storefront: a median promise of 46 minutes, with 52% of checks over 45. The owner asks whether to add a second kitchen to shorten the promise. The honest answer from this data is narrower. The promise is what the app displays, it is a first read over a few days, and on another platform in another city it moved by seven minutes (37 → 30) within a month. The number to collect before the decision is coverage by district — and that is exactly the number we do not yet have for Riyadh.
Now the thesis pair. Abu Dhabi and Dubai get near-identical Deliveroo promises — 30 and 25 minutes — but very different coverage: 73% and 98%. Five minutes apart on the storefront (25 against 30); on the map, one check in four in Abu Dhabi finds nothing. Radius is about presence, not speed.
A month moves the map and the minutes
Neither coverage nor the promise is a fixed property of a city. Both moved inside a single month, in both directions.
On the map: Talabat Dubai gained 4.6 points of coverage between July and August, from 85.3% to 89.9%. Deliveroo Abu Dhabi lost 7.1 points, from 79.7% to 72.6%. The kitchens did not move; the map did.
On the minutes: the promise Talabat Dubai showed moved from a median 37 minutes to 30. On Talabat, the share of checks promising under 30 minutes rose from 15.5% to 53.6% in Dubai and from 22% to 55% in Abu Dhabi. The phrasing matters: the promise the app showed changed. This data does not say deliveries got faster, and a seven-minute shift in a displayed lower bound within one month is a reason to re-read the storefront, not to re-time the kitchen.
For a restaurant, the takeaway is operational. Both numbers are set on the platform side and move without notice. A brand that read 79.7% coverage in Abu Dhabi in July is planning, in August, on a map that shows 72.6%. A coverage check is a monthly task, not a launch task.
Planning the next branch by the map
The storefront minutes are the wrong input for an expansion decision. Three moves replace them:
- Check coverage at real addresses, per platform, before you sign. Before a lease or a virtual-brand launch, pick addresses in the target districts and check whether the brand is found and orderable there on each platform separately. In Dubai the two platforms disagreed at one address in ten; the disagreements are where the next kitchen goes.
- Keep “found but closed” as its own line. It is not coverage and it is not downtime. When the storefront appears but does not take orders, look at schedules, pause states and zone assignment on that platform, and fix it there.
- Re-check monthly. Coverage moved 4.6 points up on one platform in one city and 7.1 points down on another within a month; the displayed promise moved seven minutes (37 → 30). A map read at launch is a map of launch month.
This is what Kitchain Coverage is built for. It maps, district by district, which branch delivers where, where nobody delivers and what delivery time the app promises — outside-in, from the same public storefront pages a customer opens, so the map is what customers actually see rather than what the zone settings say. No integration, no platform login; setup takes about 10 minutes, and the first location is configured for you.
How we measured
- Coverage is the share of addresses across the city where the brand is found and accepting an order, median over the month. “Not found” shares are more sensitive than the median to which brands are in the sample.
- The promise is the platform’s displayed delivery time at check time, the lower bound of the window. It is not the actual delivery time, and we make no claim about how long deliveries took.
- Sample: brands monitored by Kitchain in Dubai, Abu Dhabi and Riyadh — a few dozen brands on Deliveroo and Talabat, a handful on Keeta. These are client brands, not the market as a whole; brands are not named. Demo accounts are included.
- Period: August 2026, with July 2026 for the month-on-month comparison. Keeta was measured from late August only, 5–8 days, so its figures are a first read with no month-on-month comparison.
- Method v1.
Glossary:
- Coverage — share of addresses across the city where the brand is found and accepting an order.
- Promised delivery time — the delivery time the app displays at the moment of the check, lower bound of the window.
- Found but closed — the storefront appears at the address but is not taking orders.
- Restaurant–platform pair — one brand on one platform; coverage and the promise are measured per pair, not per brand.